Financial Analytics Agent

 Eve
Eve
 AI SDK
 Next.js
 PostgreSQL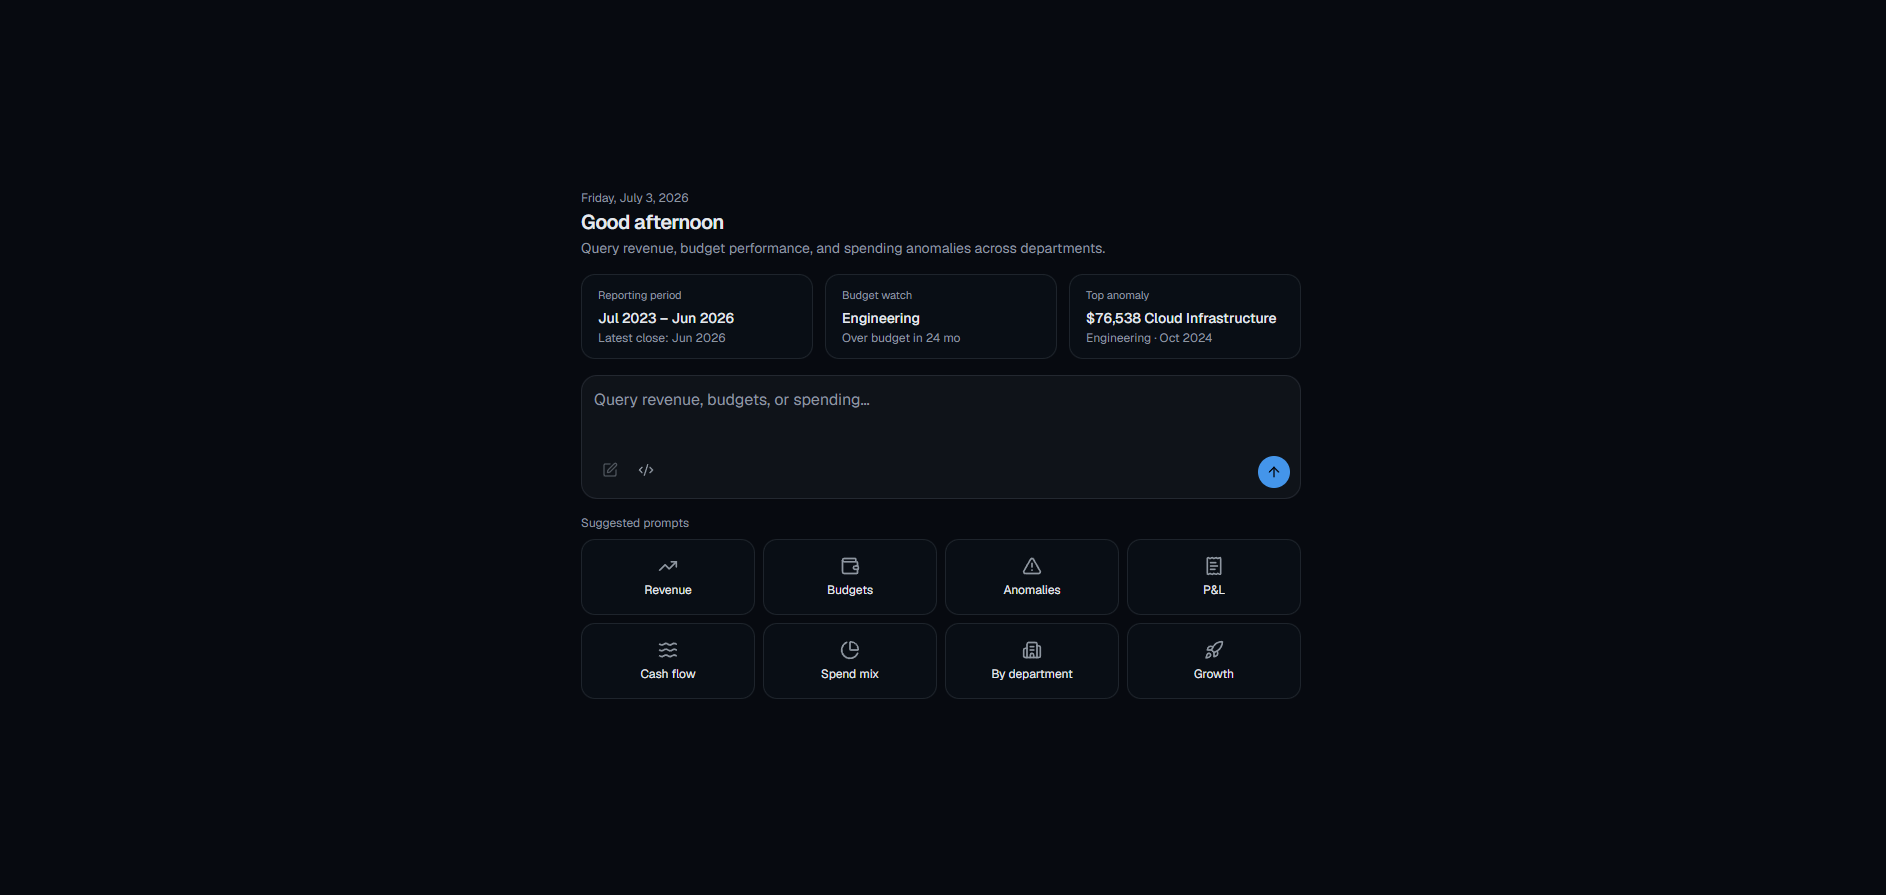
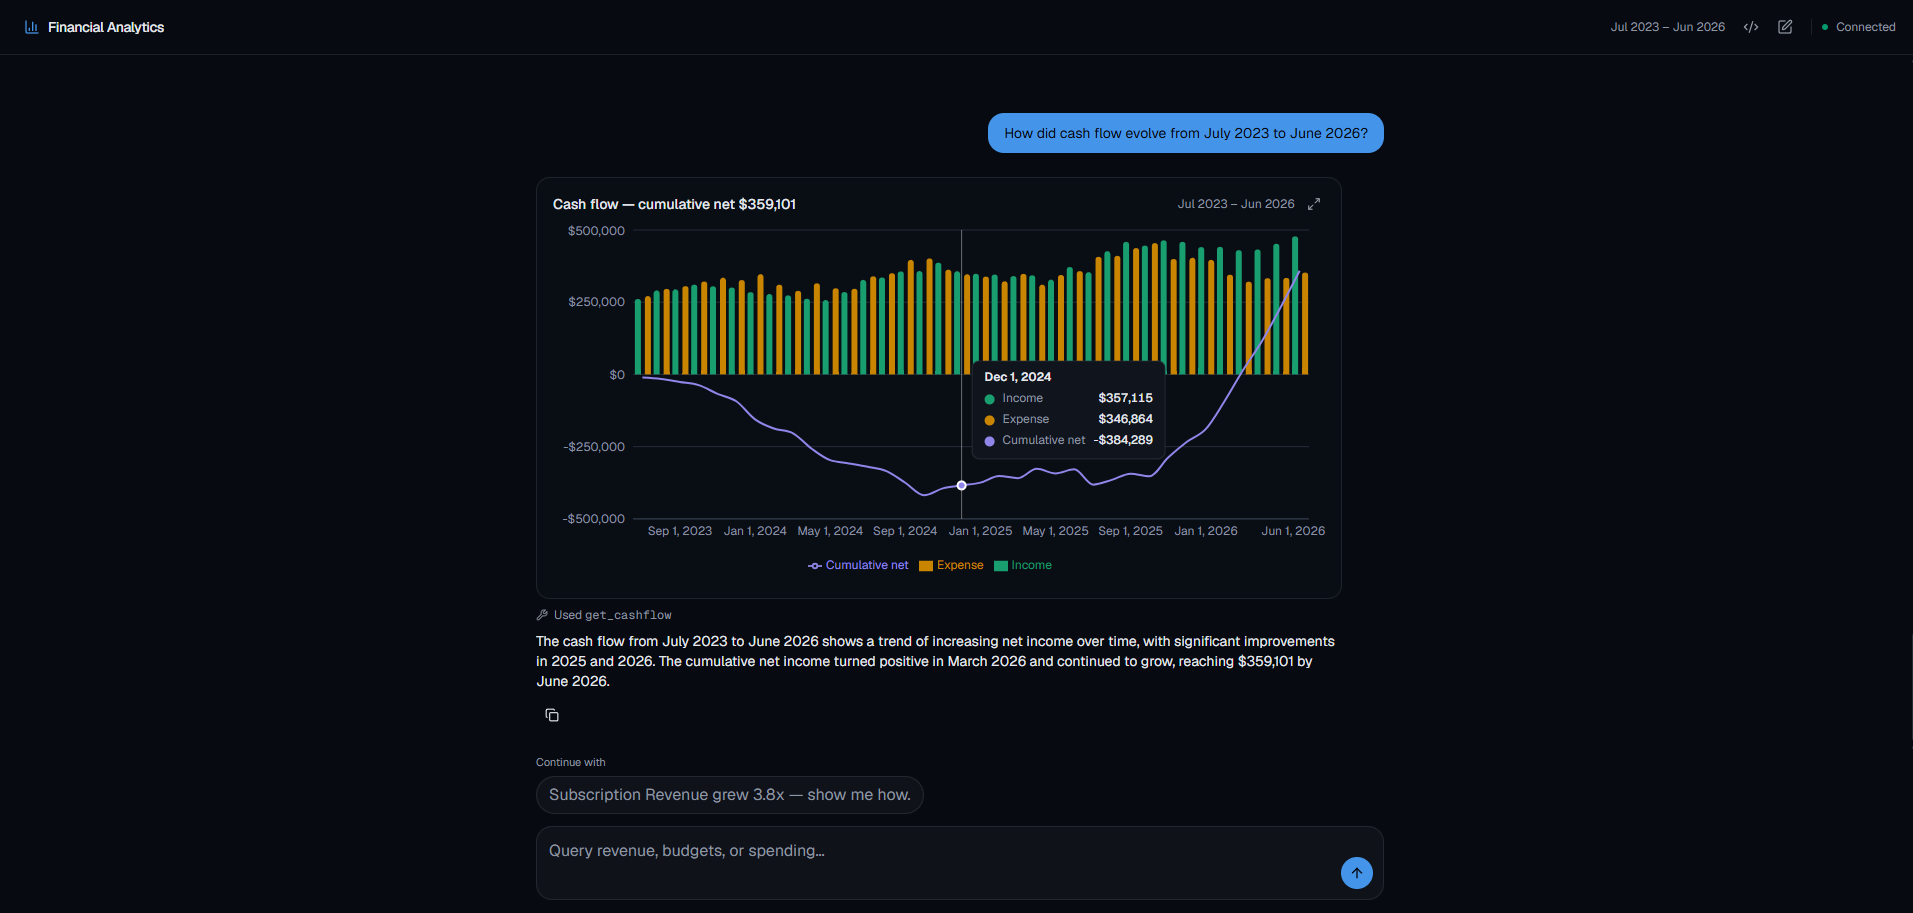
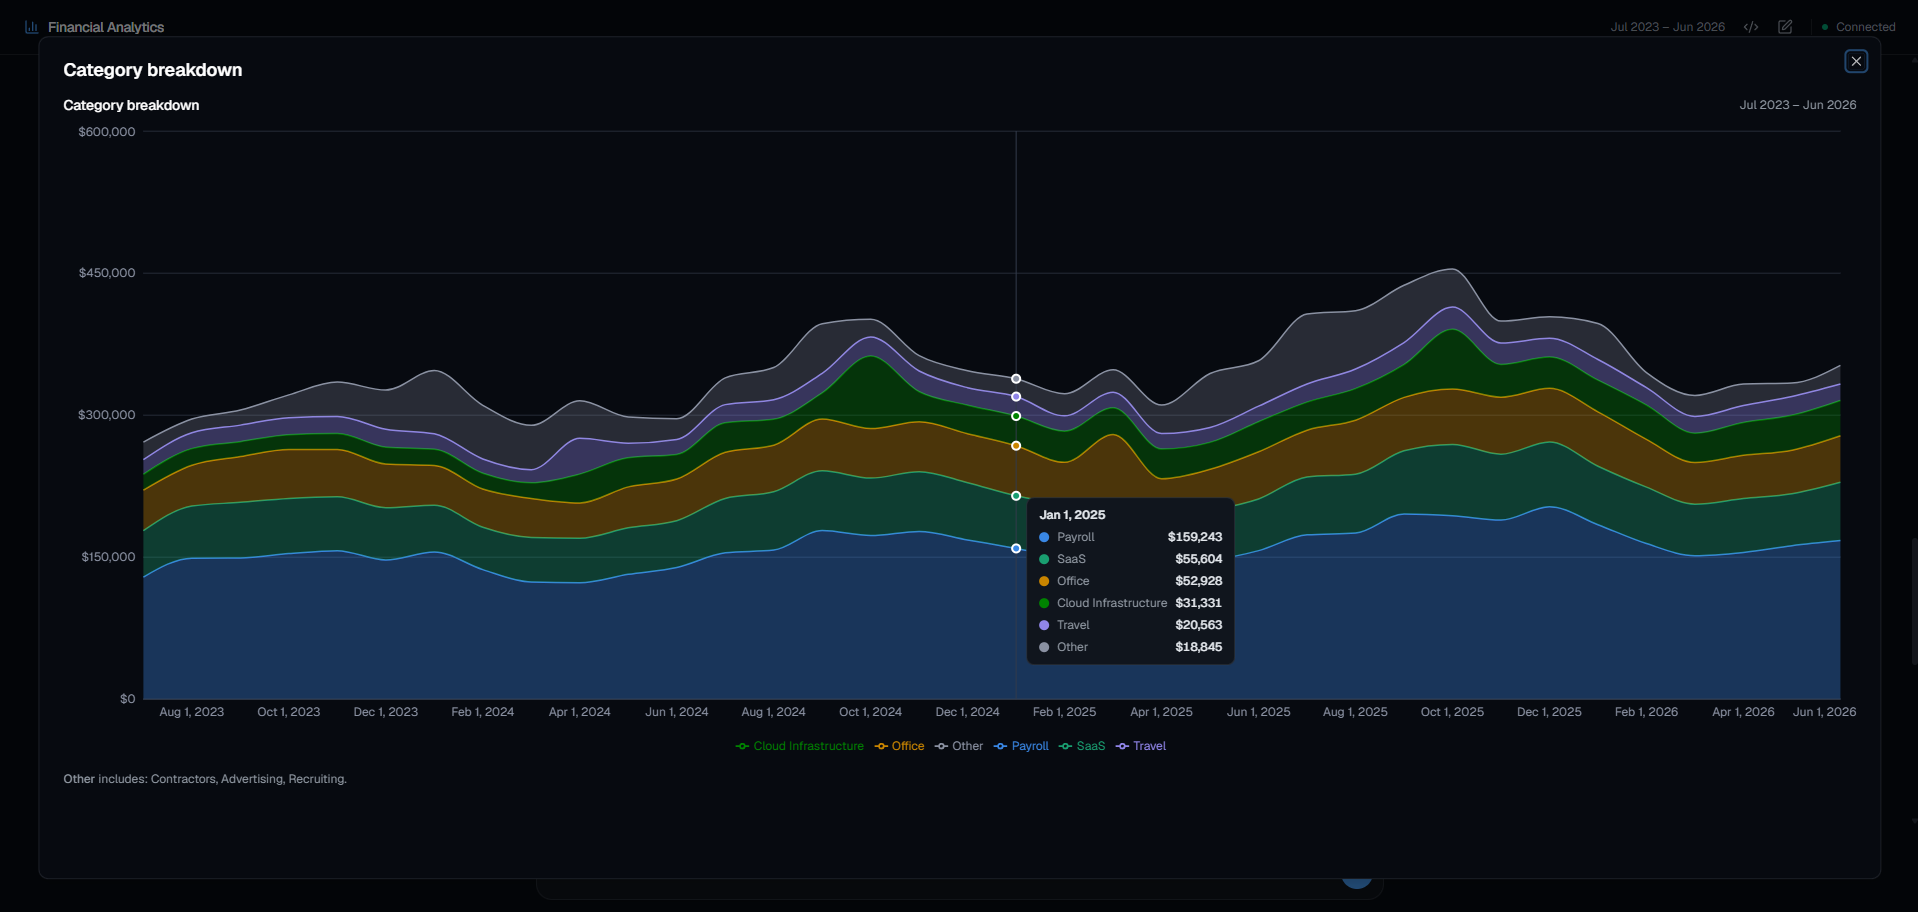
Financial Analytics Agent is a senior-financial-analyst AI agent for a fictional company ("Northwind Labs") that answers natural-language questions about revenue, budgets, and spending anomalies with real charts rendered inline in a Next.js web chat, solving the "ask the spreadsheet a question" problem without a BI dashboard or a data analyst in the loop.
Architecture and Tech Stack
Core Architecture
- Agent framework: eve (filesystem-first durable agent framework) — instructions, tools, and skills are files eve compiles and runs
- Model: Mistral (
mistral-medium-2508) via@ai-sdk/mistraldirect integration - Frontend: Next.js 16 App Router + React 19,
useEveAgentfor the chat, same-origin (no CORS, no base-URL env vars) - Database: Postgres (Neon via Vercel Marketplace),
postgres.jsclient - Validation: Zod for every tool input and REST query parameter
- UI: Tailwind CSS 4 + shadcn/ui + Vercel AI Elements (
PromptInput,Conversation,Suggestion) + Recharts
Layered Architecture
Client → agent + REST API → one shared analytics library → Postgres. The agent's tools and the public REST routes call the exact same functions in agent/lib/finance.ts — there is no HTTP hop between the agent and its own data, so it runs standalone under eve dev --no-ui with no Next.js process at all.
Request Flow
Key Features
Tools at a Glance
Natural-language financial Q&A
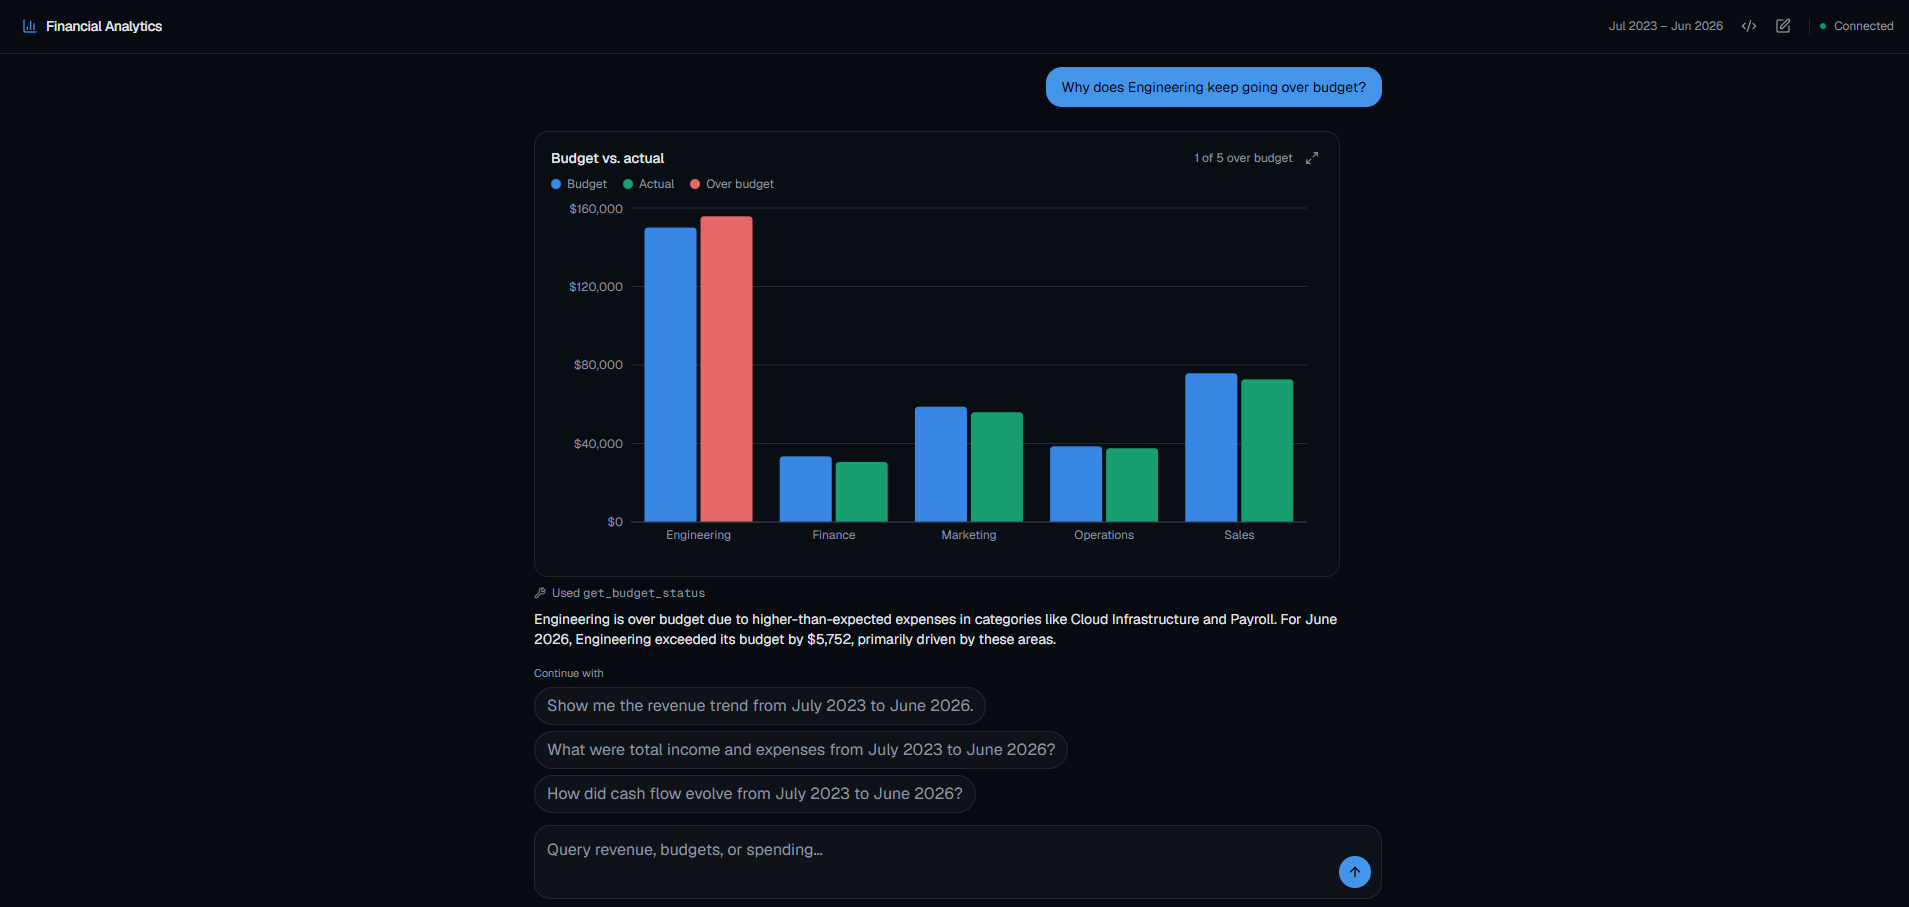
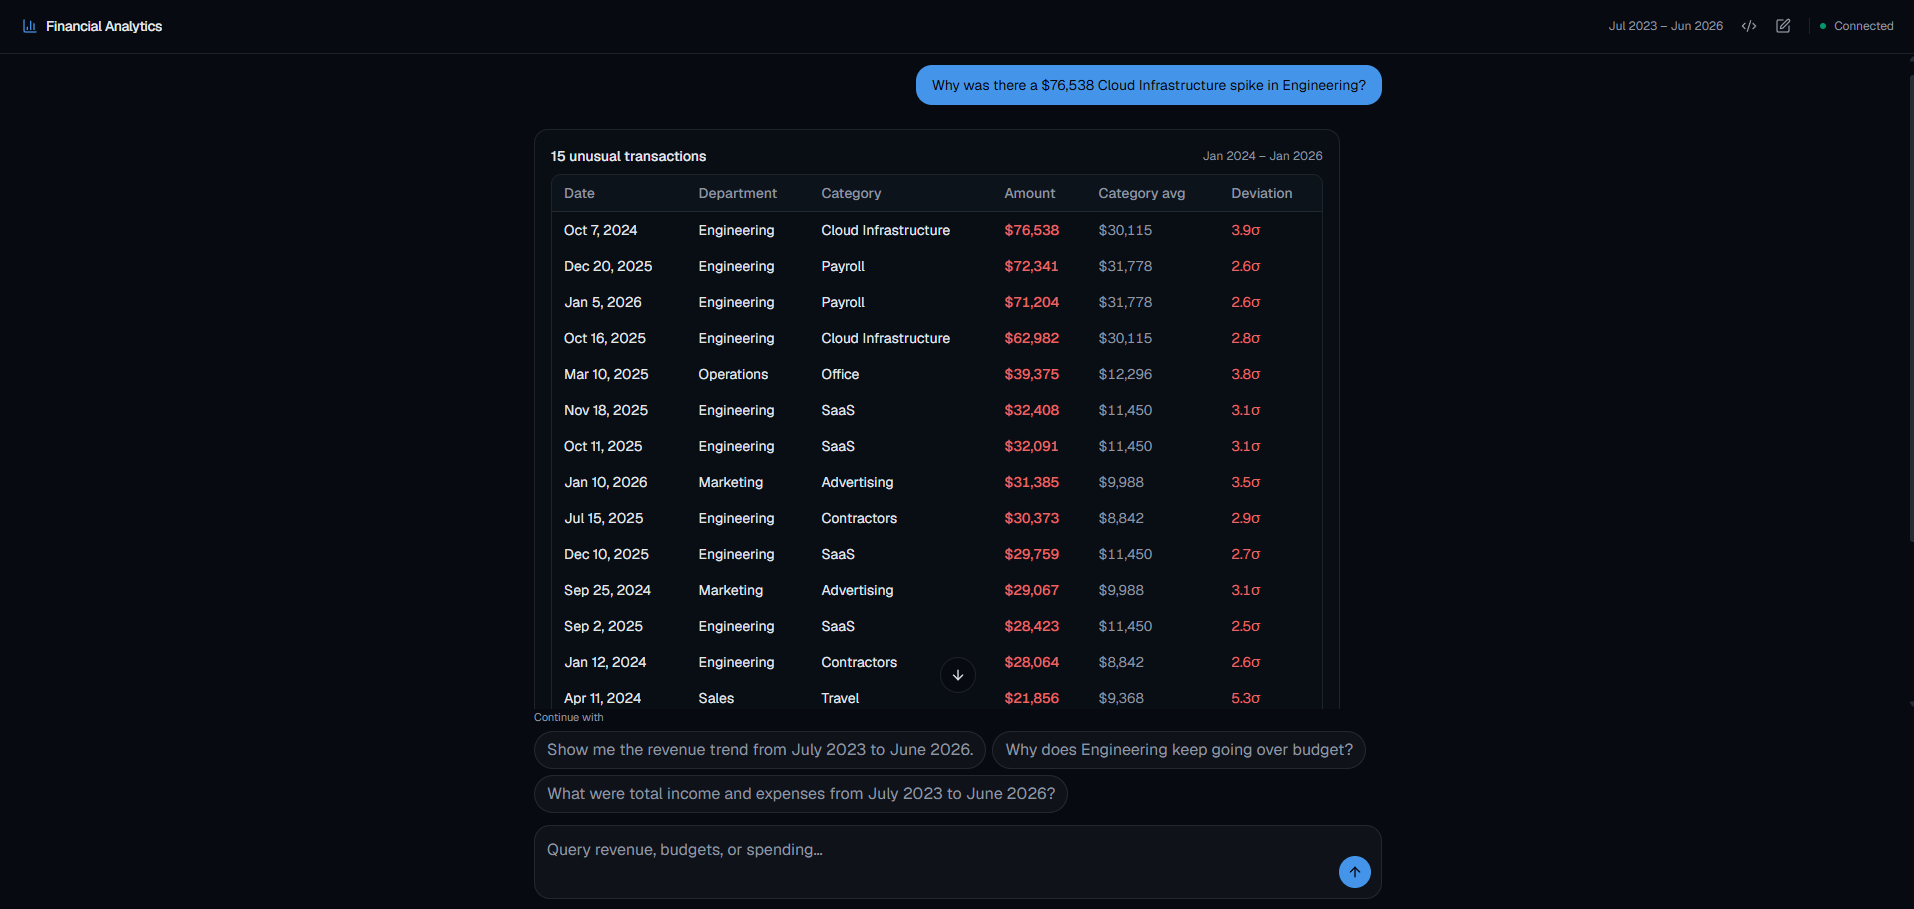
Eight analytics, each backed by a typed tool and a documented REST route: revenue/expense trend (by month or department), budget vs. actual with variance, anomaly detection (category-relative std-dev outliers), category/spend-mix breakdown, cash flow with cumulative net, profitability by department (income vs. expense and net/margin per team, net contributors vs. cost centers), a plain-totals summary, and a dataset-overview endpoint for meta questions ("how many transactions do we have").
On-demand financial-analysis skill
Beyond raw totals, an eve skill (loaded only when a question needs it, not on every turn) teaches the model margin, MoM/YoY growth, CAGR, and budget-variance formulas — and explicitly instructs it to refuse a runway estimate rather than fabricate one, since the schema has no cash-balance figure to support it.
Authored synthetic dataset, not random noise
Three years of deterministic Postgres data (fixed RNG seed, reproduces identically on every reseed) built around real stories: yearly seasonality and growth on revenue, a compounding subscription-revenue line with a recurring churn dip, a recurring ad-campaign spend spike, a platform-migration cost step-change plus two infrastructure incidents, two contractor project ramps, two hiring pushes, and one-off office/travel spikes — so every chart type has something genuine to show, and anomalies aren't always in the same one or two departments.

Data-grounded suggested questions
The empty-state chips aren't static placeholders — they're built from a live /api/finance/highlights call (biggest anomaly, most-over-budget department, fastest-growing revenue category) computed with real SQL, so the very first thing a visitor sees already reflects the actual seeded data.
Behavior-level regression tests, not just unit tests
A pnpm eval suite (eve's defineEval) drives the live agent through real conversations and asserts on what it actually did — e.g. that comparing two named departments narrows the chart to just those two, or that an anomaly's returned list only covers the categories asked about — catching prompt/tool regressions that a type-level test can't see.
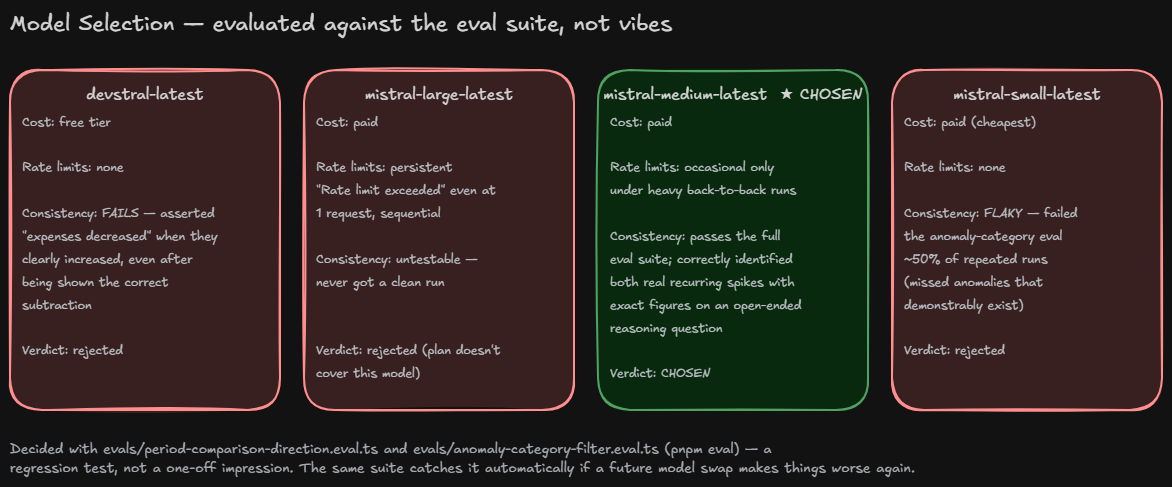
Model choice validated by the eval suite, not vibes
Four Mistral models were run against the same eval suite before picking one: the original model failed the arithmetic-safety eval outright, a larger model hit persistent rate limits on this API key, a cheaper model passed —but failed the same anomaly eval on roughly half of repeated runs—, and the model actually shipped is the only one that passed consistently and gave a materially better answer on an open-ended reasoning question. The same eval suite would catch a regression if a future swap makes things worse again.
Technical Highlights
Color-accurate, order-aware chart tooltips
A custom Recharts tooltip renderer pairs every value with the exact swatch color the chart draws it in (the default library tooltip lets a themed content style strip that color-coding), and orders rows either by value (for crossing lines, so top-to-bottom in the tooltip matches top-to-bottom on screen) or by declared order (for grouped bars/stacks, where reordering would break the visual correspondence).
Expand-to-near-fullscreen chart view
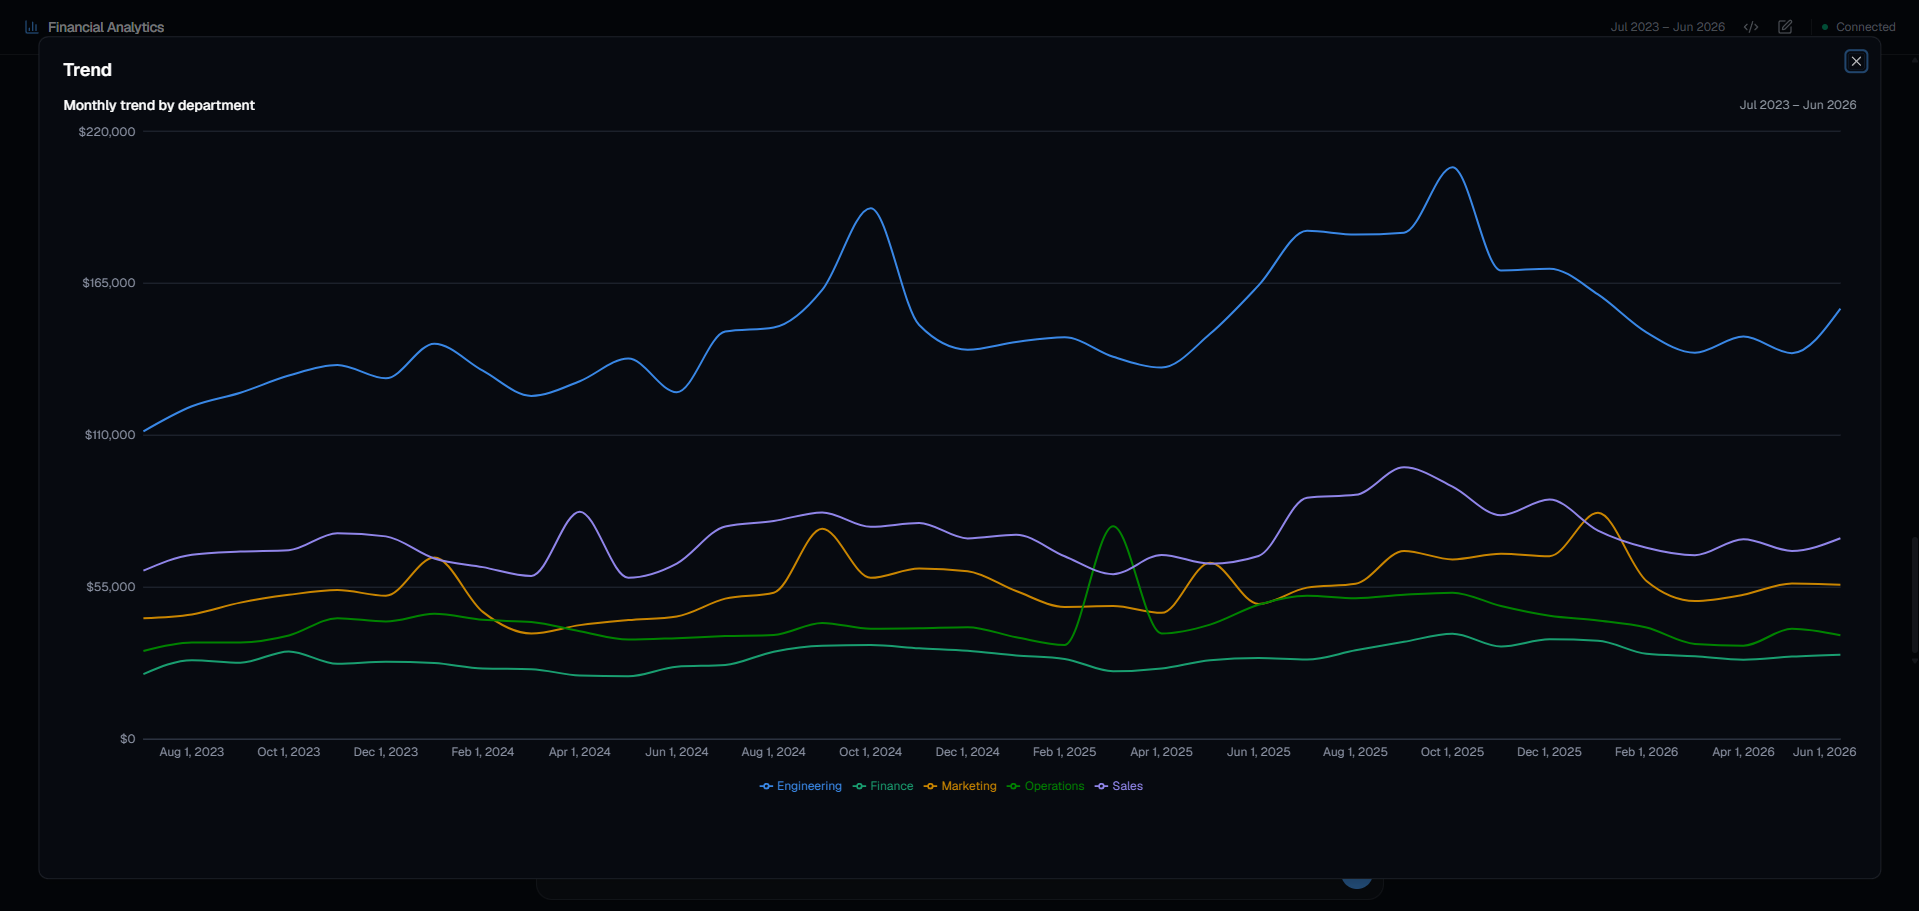
Every chart renders twice — compact inline, and at dialog scale (96vw × 92vh) behind an expand button — from the same pure, data-driven component, so there's no duplicated chart logic between the two sizes.
Always-fresh agent context, never a hardcoded date
A defineDynamic resolver fires on session.started and computes "today" plus the live data-coverage range fresh every session, instead of a literal date baked into the compiled instructions at build time (the classic failure mode of an agent that thinks it's still the day it was deployed).
One shared analytics layer, two front doors
agent/lib/finance.ts is called by both the agent's authored tools and the REST routes (via a shared parseQuery Zod helper) — one set of SQL queries, two ways to reach it: natural language for people, plain HTTP for machines/scripts.
Project Structure
agent/
├── agent.ts                  # Model config (Mistral)
├── instructions.md            # Static persona + rules, no literal dates
├── instructions/dates.ts      # Dynamic "today" + data-range resolver
├── skills/financial-analysis/ # On-demand ratios/formulas skill
├── hooks/log-action-failures.ts # Logs any failed tool/skill call
├── lib/
│   ├── finance.ts             # Shared analytics queries
│   ├── finance.types.ts
│   ├── api-route.ts           # REST query-parsing helper
│   ├── db.ts / stats.ts / rng.ts
└── tools/
    ├── get_summary.ts
    ├── get_trend.ts
    ├── get_budget_status.ts
    ├── get_anomalies.ts
    ├── get_category_breakdown.ts
    ├── get_cashflow.ts
    ├── get_profitability.ts
    └── get_data_overview.ts

app/
├── _components/
│   ├── agent-chat.tsx          # Chat orchestration
│   ├── agent-chat/             # Nav, empty-state, highlights hook
│   └── tool-result/            # One file per chart type
└── api/finance/*/route.ts      # REST endpoints, thin over the shared lib

evals/
├── evals.config.ts
└── *.eval.ts                  # Behavior-level regression tests (pnpm eval)

db/
├── schema.sql
├── migrate.ts
└── seed.ts                     # 3-year deterministic synthetic data
Impact and Scalability
- Open source: code available on GitHub
- Documented REST API: the same analytics are consumable outside the chat — by a script, a dashboard, or another service — with zero extra backend code
- Deterministic & reproducible: reseeding the database always produces byte-identical demo numbers, so the demo never drifts
- Extensible by design: adding a new analytic touches exactly four files (type, query, tool, REST route) plus one chart component — a documented, repeatable pattern rather than ad-hoc additions
- Not just a chat toy: the finance logic, the REST surface, and the agent tools are three views over one real analytics layer, the shape a production integration would actually take
Notes
The project is built on eve (a filesystem-first durable agent framework) and the Vercel AI Elements / shadcn design system. Code is public on GitHub. For a deeper technical deep-dive, see the full documentation wiki.